Demonstration Project Only: This platform utilizes archived data from 2025 for analysis purposes. It does NOT reflect real-time conditions. Never use for flight planning or navigation. Consult official AIS sources.
From Raw Data to Strategic Awareness
How this demo platform transforms thousands of unstructured NOTAMs into actionable visual intelligence.
1. Ingest & Filter
We parse archived 2025 NOTAMs, discarding non-physical data and isolating obstacles like wind turbines and masts.
2. Classify & Map
Data is geolocated and categorized by type (Wind, Crane, Mast) and flagged for hazards like "Unlit" status.
3. Visualize Risk
Presenting the data on an operational map for scanning or an analytics dashboard for strategic saturation analysis.
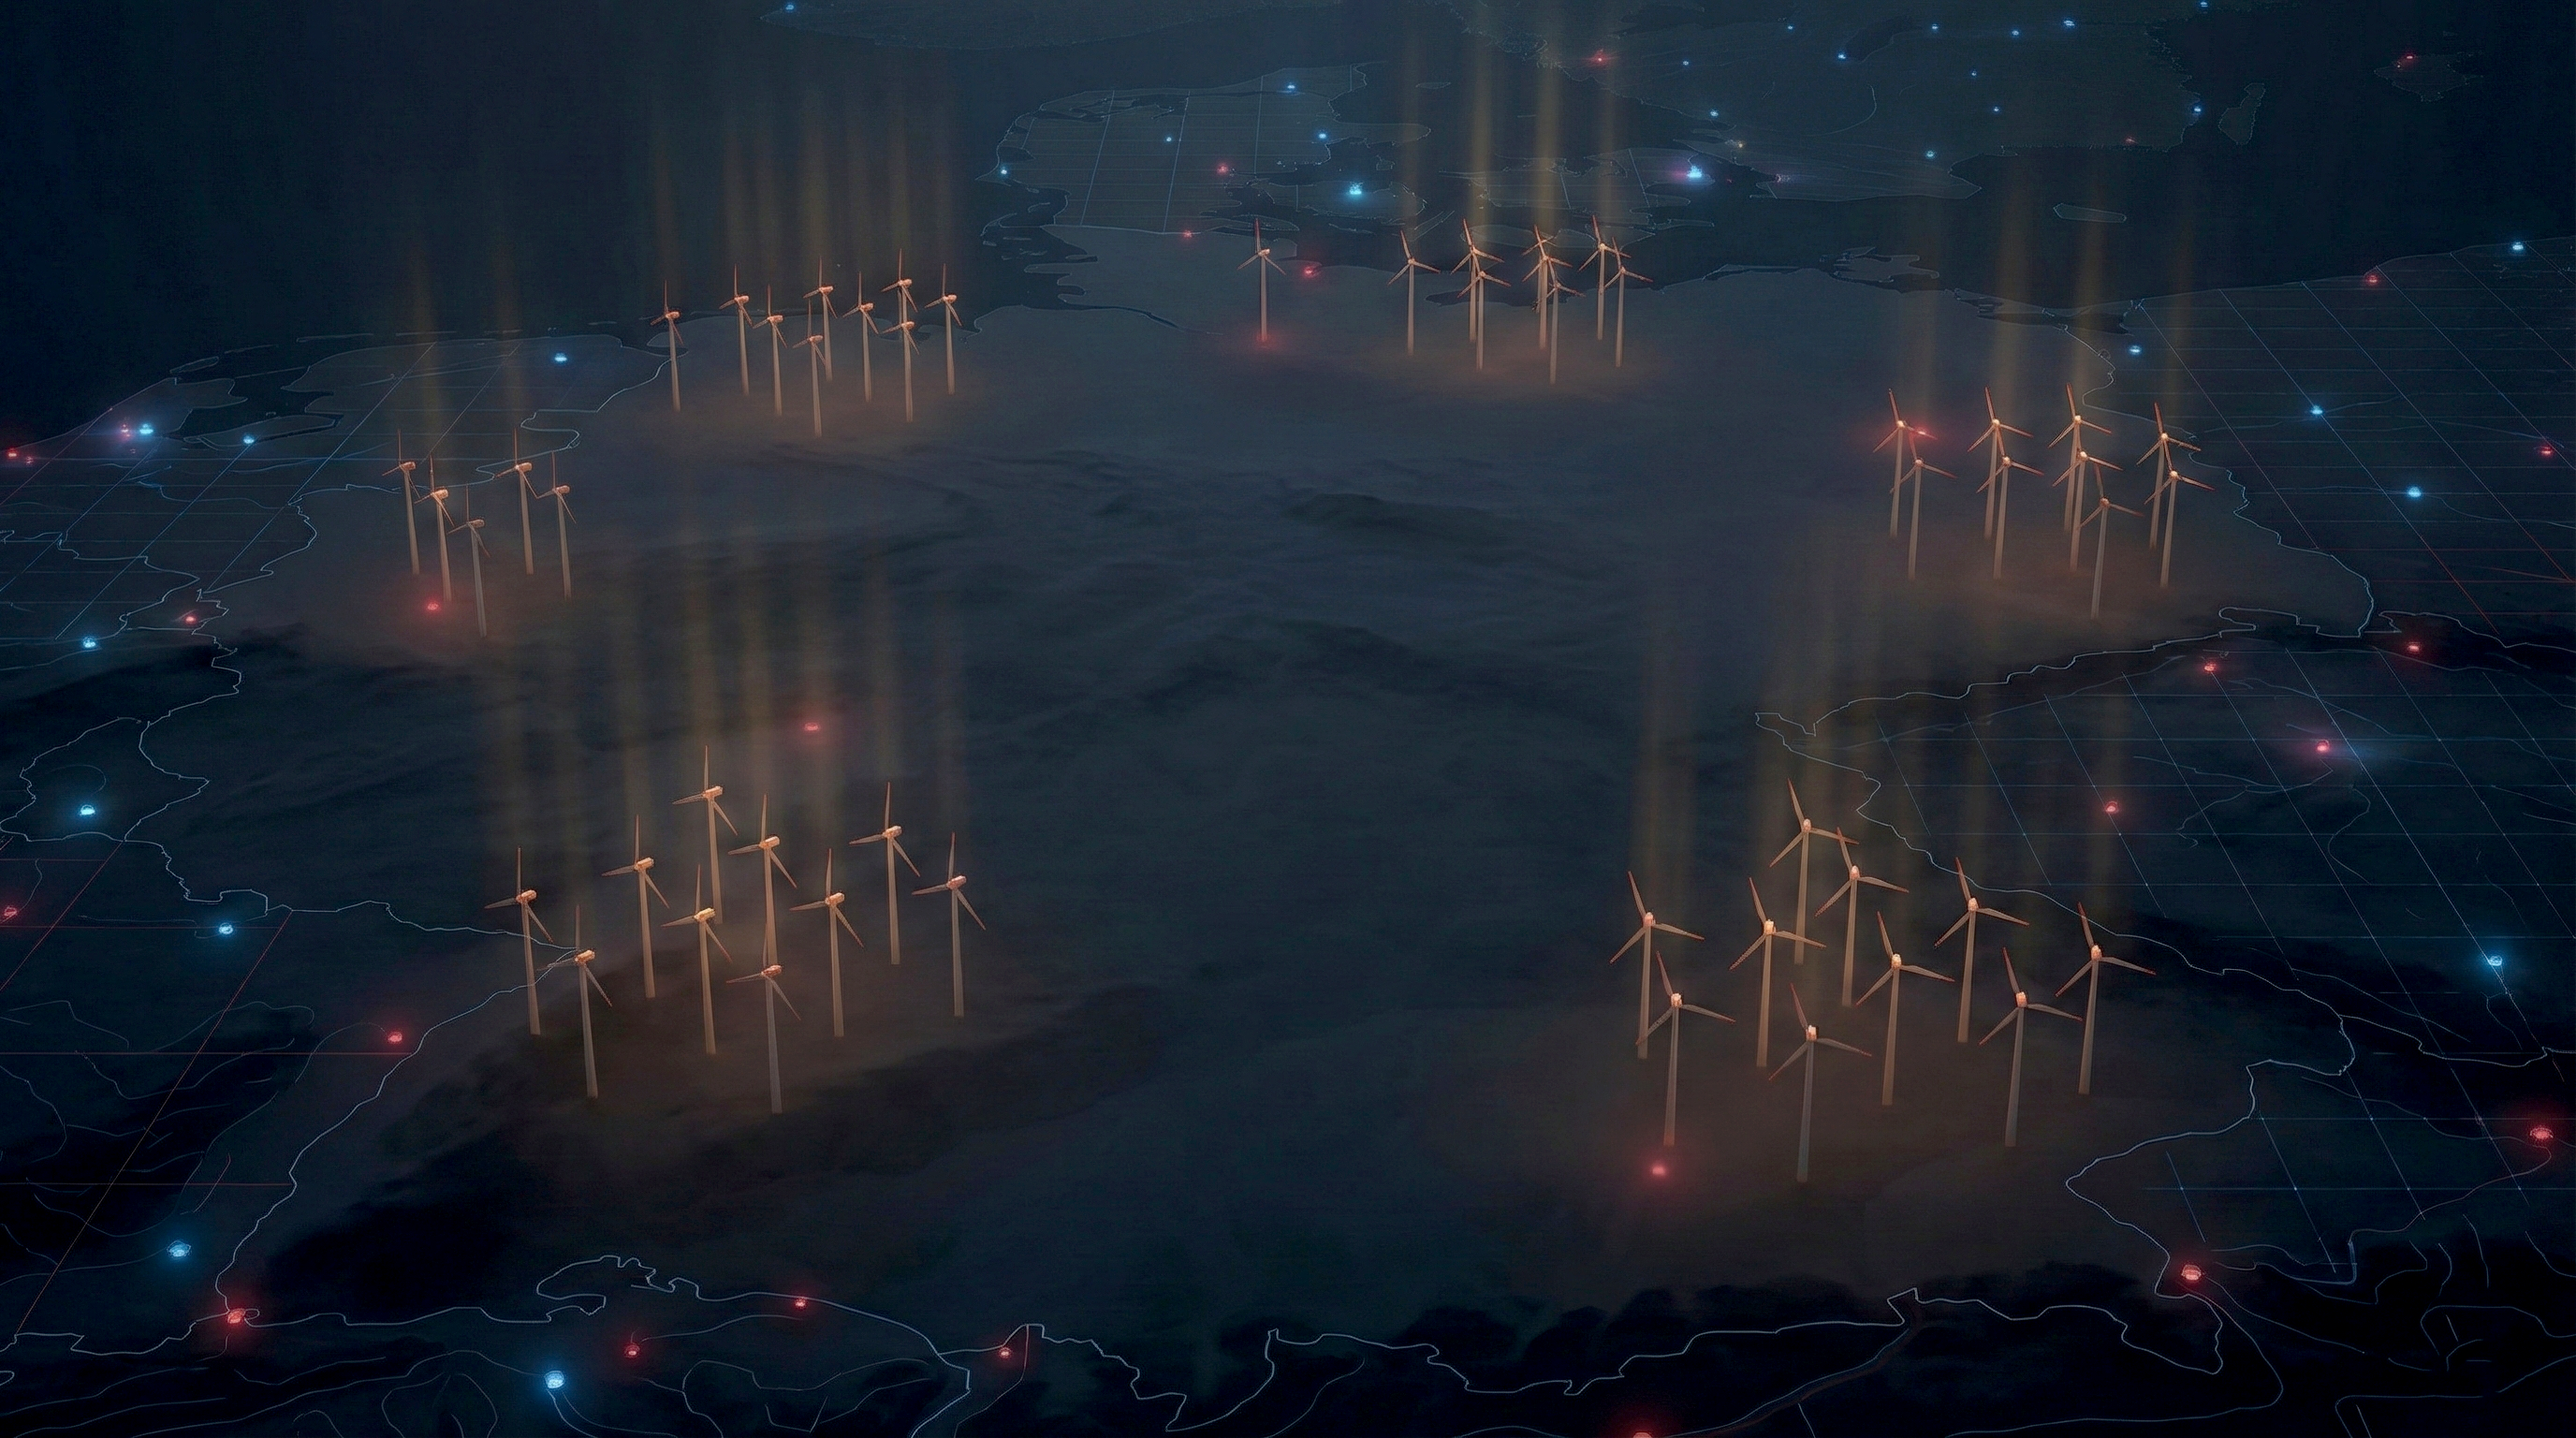
Wind Farm Saturation
Visualize the density of wind parks and their collective impact on VFR corridors, specifically in coastal and northern regions.
NVFR: Unlit Obstacles
Critical identification of masts, cranes, and turbines with "OUT OF SERVICE" lighting, posing high risks for Night VFR.
Vertical Analytics
Filter obstacles by Flight Level (FL). Analyze height distribution to identify clear vertical airspace bands.
2025 Archived Data
Built on a static snapshot of DFS NOTAM data from January 2025 for stable post-event analysis and demonstration.